Slab Plasma
This demonstration uses the utility function
build_slab_plasma() to assemble a slab of plasma
defined along the positive x axis. It is a useful tool for defining a simple plasma
to be used in the testing of emission models.
import numpy as np
import matplotlib.pyplot as plt
from raysect.optical import World

from cherab.core.math import sample3d
from cherab.core.atomic import hydrogen, carbon
from cherab.tools.plasmas.slab import build_slab_plasma
from cherab.openadas import OpenADAS


# make a slab plasma
world = World()
plasma = build_slab_plasma(peak_density=5e19, impurities=[(carbon, 6, 0.005)], parent=world)
plasma.atomic_data = OpenADAS(permit_extrapolation=True)

####################
# Visualise Plasma #

h0 = plasma.composition.get(hydrogen, 0)
h1 = plasma.composition.get(hydrogen, 1)
c6 = plasma.composition.get(carbon, 6)

r, _, z, t_samples = sample3d(h1.distribution.effective_temperature, (-1, 2, 200), (0, 0, 1), (-1, 1, 200))
plt.imshow(np.transpose(np.squeeze(t_samples)), extent=[-1, 2, -1, 1])
plt.colorbar()
plt.axis('equal')
plt.xlabel('x axis')
plt.ylabel('z axis')
plt.title("Ion temperature profile in x-z plane")

plt.figure()
r, _, z, t_samples = sample3d(h1.distribution.effective_temperature, (0, 0, 1), (-1, 1, 200), (-1, 1, 200))
plt.imshow(np.transpose(np.squeeze(t_samples)), extent=[-1, 1, -1, 1])
plt.colorbar()
plt.axis('equal')
plt.xlabel('x axis')
plt.ylabel('y axis')
plt.title("Ion temperature profile in y-z plane")

plt.figure()
r, _, z, t_samples = sample3d(h0.distribution.density, (-1, 2, 200), (0, 0, 1), (-1, 1, 200))
plt.imshow(np.transpose(np.squeeze(t_samples)), extent=[-1, 2, -1, 1])
plt.colorbar()
plt.axis('equal')
plt.xlabel('x axis')
plt.ylabel('z axis')
plt.title("Neutral Density profile in x-z plane")

plt.show()
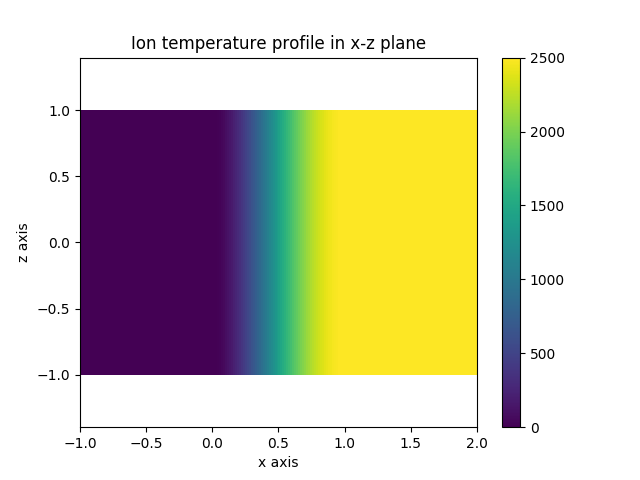
Caption: The ion temperature profile with a pedestal starting at x=0.
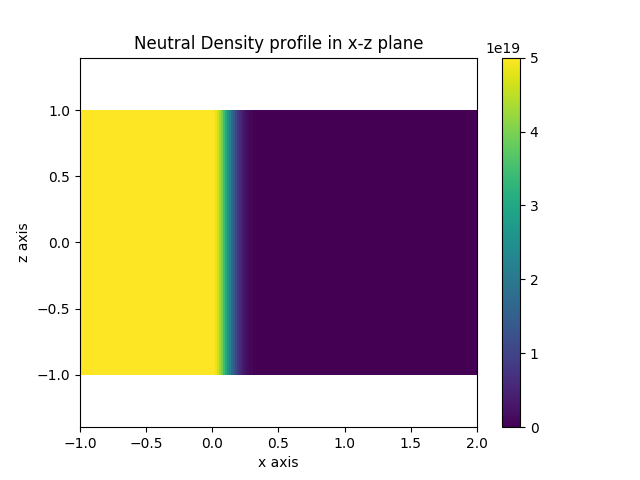
Caption: The neutral density profile, constant for x<0 and then attenuated by the plasma.