Beams into plasmas
This demonstration shows how to define a mono-energetic neutral particle beam that interacts with a plasma. Beams such as these are commonly used in fusion plasmas for power injection and current drive, usually abbreviated as NBI.
In this demo we create a slab of plasma that has a pedestal starting at x=0 in the y-z plane. The pedestal extends for some defined length before reaching a flat top for x>pedestal_length. We then define a beam composed of three different energy components. The rest of the code visualises the results.
import numpy as np
import matplotlib.pyplot as plt

from raysect.core import translate, rotate_basis, Vector3D
from raysect.optical import World
from raysect.optical.observer import PinholeCamera

from cherab.core import Beam
from cherab.core.math import sample3d
from cherab.core.atomic import hydrogen, deuterium, carbon, Line
from cherab.core.model import SingleRayAttenuator, BeamCXLine
from cherab.tools.plasmas.slab import build_slab_plasma
from cherab.openadas import OpenADAS


###############
# Make Plasma #

world = World()

plasma = build_slab_plasma(peak_density=5e19, impurities=[(carbon, 6, 0.005)], parent=world)
plasma.atomic_data = OpenADAS(permit_extrapolation=True)

####################
# Visualise Plasma #

h0 = plasma.composition.get(hydrogen, 0)
h1 = plasma.composition.get(hydrogen, 1)
c6 = plasma.composition.get(carbon, 6)

# Run some plots to check the distribution functions and emission profile are as expected
r, _, z, t_samples = sample3d(h1.distribution.effective_temperature, (-1, 2, 200), (0, 0, 1), (-1, 1, 200))
plt.imshow(np.transpose(np.squeeze(t_samples)), extent=[-1, 2, -1, 1])
plt.colorbar()
plt.axis('equal')
plt.xlabel('x axis')
plt.ylabel('z axis')
plt.title("Ion temperature profile in x-z plane")

plt.figure()
r, _, z, t_samples = sample3d(h1.distribution.effective_temperature, (0, 0, 1), (-1, 1, 200), (-1, 1, 200))
plt.imshow(np.transpose(np.squeeze(t_samples)), extent=[-1, 1, -1, 1])
plt.colorbar()
plt.axis('equal')
plt.xlabel('x axis')
plt.ylabel('y axis')
plt.title("Ion temperature profile in y-z plane")

plt.figure()
r, _, z, t_samples = sample3d(h0.distribution.density, (-1, 2, 200), (0, 0, 1), (-1, 1, 200))
plt.imshow(np.transpose(np.squeeze(t_samples)), extent=[-1, 2, -1, 1])
plt.colorbar()
plt.axis('equal')
plt.xlabel('x axis')
plt.ylabel('z axis')
plt.title("Neutral Density profile in x-z plane")


###########################
# Inject beam into plasma #

adas = OpenADAS(permit_extrapolation=True, missing_rates_return_null=True)

integration_step = 0.0025
beam_transform = translate(-0.5, 0.0, 0) * rotate_basis(Vector3D(1, 0, 0), Vector3D(0, 0, 1))

beam_energy = 50000  # keV

beam_full = Beam(parent=world, transform=beam_transform)
beam_full.plasma = plasma
beam_full.atomic_data = adas
beam_full.energy = beam_energy
beam_full.power = 3e6
beam_full.element = deuterium
beam_full.sigma = 0.05
beam_full.divergence_x = 0.5
beam_full.divergence_y = 0.5
beam_full.length = 3.0
beam_full.attenuator = SingleRayAttenuator(clamp_to_zero=True)
beam_full.models = [BeamCXLine(Line(carbon, 5, (8, 7)))]
beam_full.integrator.step = integration_step
beam_full.integrator.min_samples = 10

beam_half = Beam(parent=world, transform=beam_transform)
beam_half.plasma = plasma
beam_half.atomic_data = adas
beam_half.energy = beam_energy / 2
beam_half.power = 3e6
beam_half.element = deuterium
beam_half.sigma = 0.05
beam_half.divergence_x = 0.5
beam_half.divergence_y = 0.5
beam_half.length = 3.0
beam_half.attenuator = SingleRayAttenuator(clamp_to_zero=True)
beam_half.models = [BeamCXLine(Line(carbon, 5, (8, 7)))]
beam_half.integrator.step = integration_step
beam_half.integrator.min_samples = 10

beam_third = Beam(parent=world, transform=beam_transform)
beam_third.plasma = plasma
beam_third.atomic_data = adas
beam_third.energy = beam_energy / 3
beam_third.power = 3e6
beam_third.element = deuterium
beam_third.sigma = 0.05
beam_third.divergence_x = 0.5
beam_third.divergence_y = 0.5
beam_third.length = 3.0
beam_third.attenuator = SingleRayAttenuator(clamp_to_zero=True)
beam_third.models = [BeamCXLine(Line(carbon, 5, (8, 7)))]
beam_third.integrator.step = integration_step
beam_third.integrator.min_samples = 10


######################################
# Visualise beam behaviour in Plasma #


plt.figure()
x, _, z, beam_density = sample3d(beam_full.density, (-0.5, 0.5, 200), (0, 0, 1), (0, 3, 200))
plt.imshow(np.transpose(np.squeeze(beam_density)), extent=[-0.5, 0.5, 0, 3], origin='lower')
plt.colorbar()
plt.axis('equal')
plt.xlabel('x axis (beam coords)')
plt.ylabel('z axis (beam coords)')
plt.title("Beam full energy density profile in r-z plane")


z = np.linspace(0, 3, 200)
beam_full_densities = [beam_full.density(0, 0, zz) for zz in z]
beam_half_densities = [beam_half.density(0, 0, zz) for zz in z]
beam_third_densities = [beam_third.density(0, 0, zz) for zz in z]
plt.figure()
plt.plot(z, beam_full_densities, label="full energy")
plt.plot(z, beam_half_densities, label="half energy")
plt.plot(z, beam_third_densities, label="third energy")
plt.xlabel('z axis (beam coords)')
plt.ylabel('beam component density [m^-3]')
plt.title("Beam attenuation by energy component")
plt.legend()


camera = PinholeCamera((128, 128), parent=world, transform=translate(1.25, -3.5, 0) * rotate_basis(Vector3D(0, 1, 0), Vector3D(0, 0, 1)))
camera.spectral_rays = 1
camera.spectral_bins = 15
camera.pixel_samples = 50

plt.ion()
camera.observe()

plt.ioff()
plt.show()
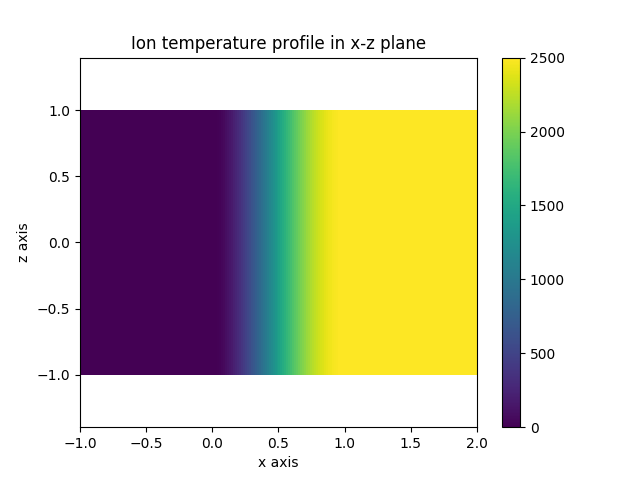
Caption: The ion temperature profile in our slab plasma.
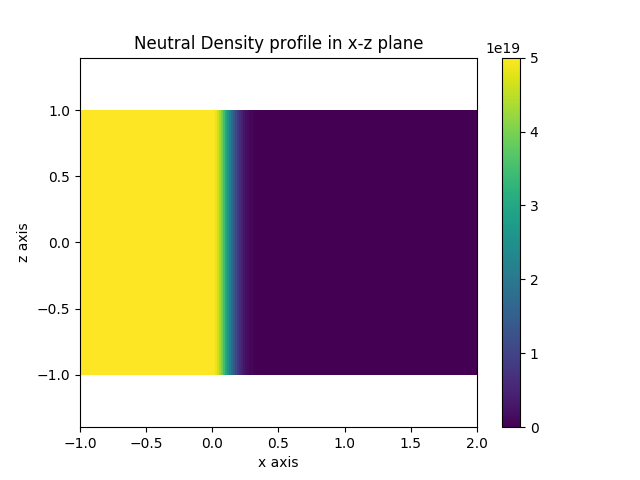
Caption: The neutral temperature profile in our slab plasma.
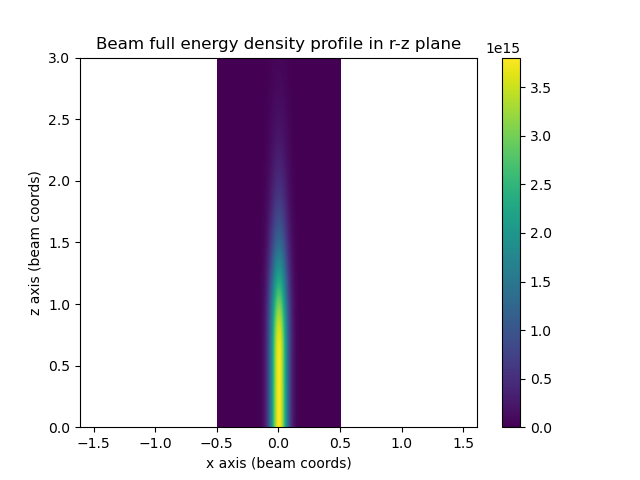
Caption: A plot of the full energy component beam density along the beam axis in the x-z plane. Note that the coordinates here are in the beam’s local coordinate system.
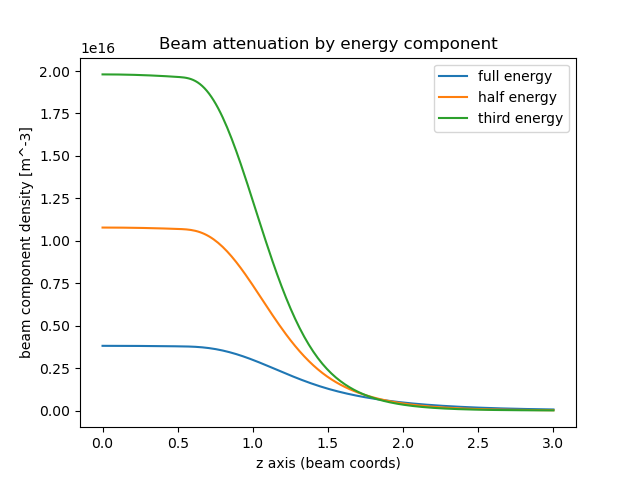
Caption: A plot of the beam attenuation for each of the beam energy components along the beam axis. Note these are plotted in local beam coordinates. So the beam origin is at the origin coordinate (0, 0, 0) and the beam axis is aligned along the z-axis.

Caption: A camera observation of the charge exchange CVI 8->7 line.